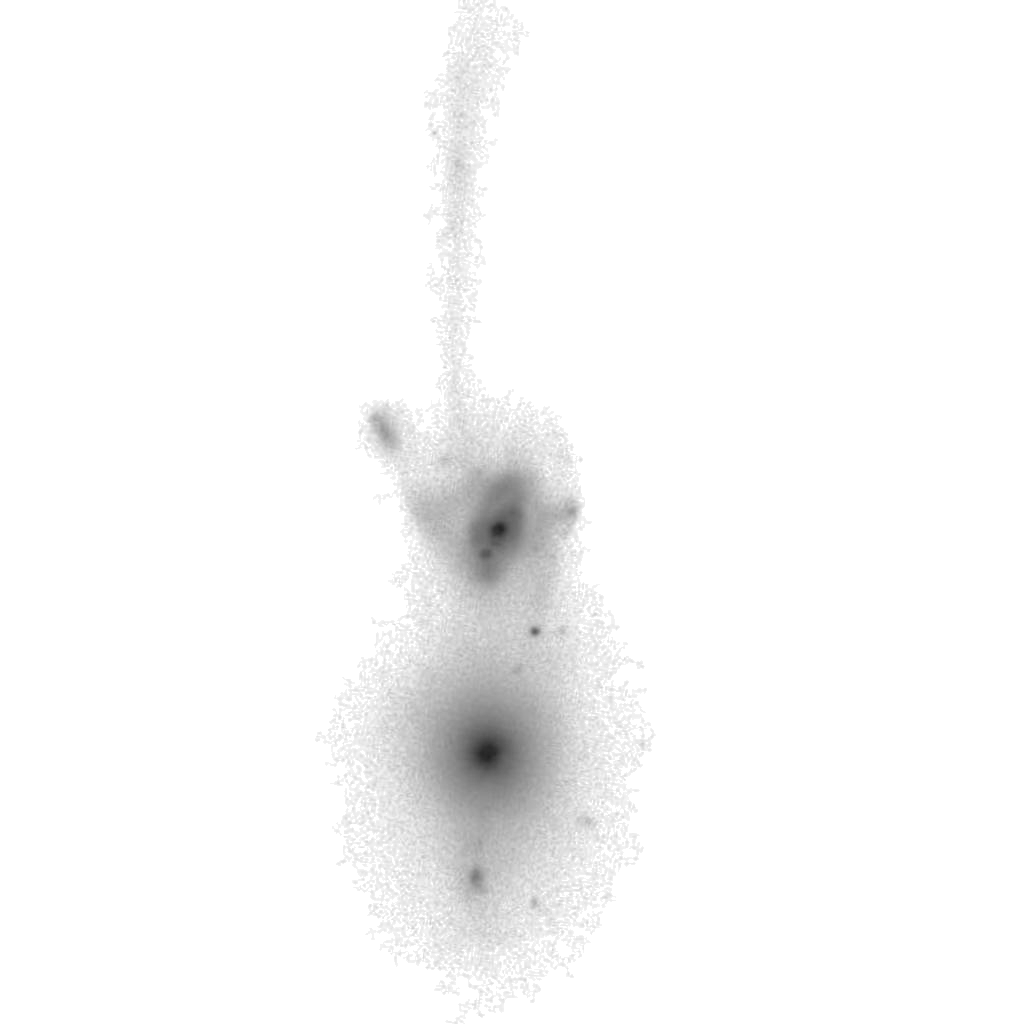
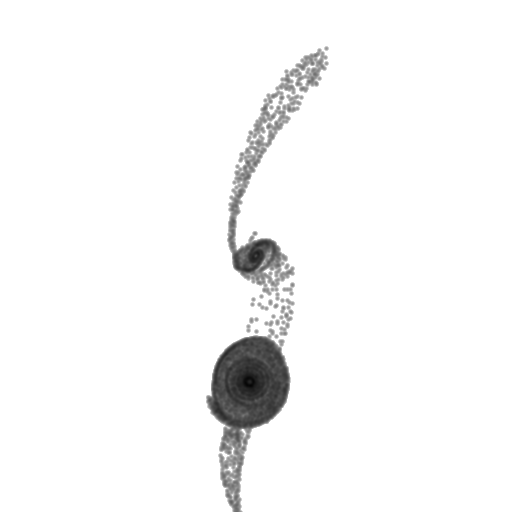
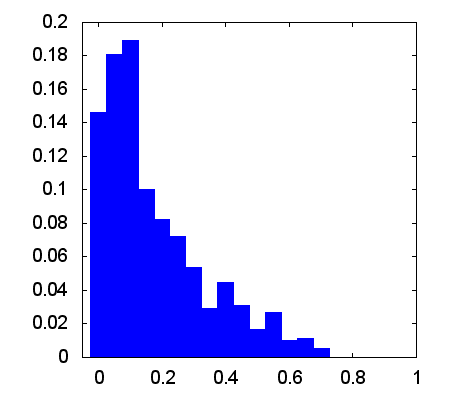
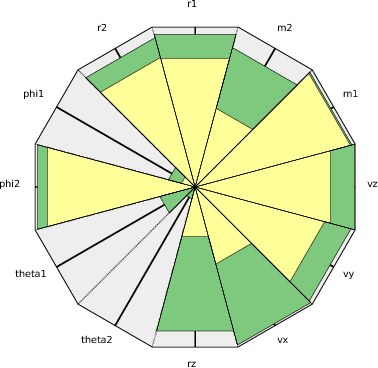
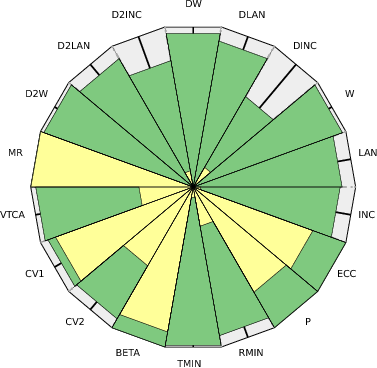
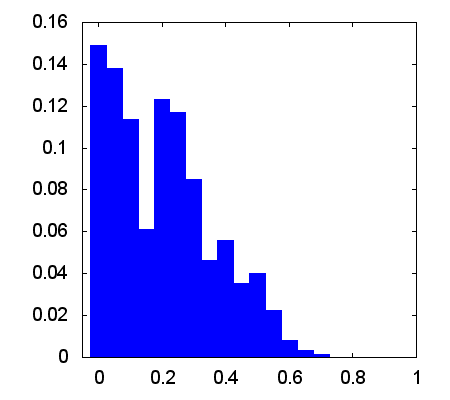
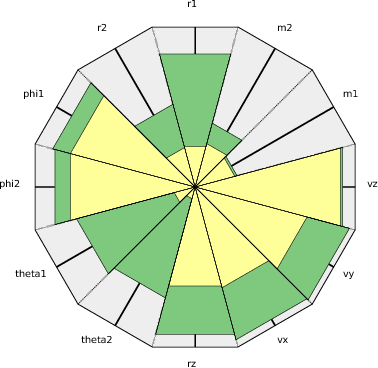
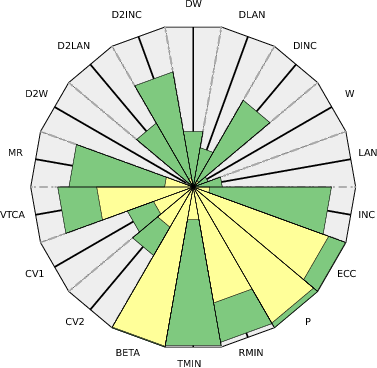
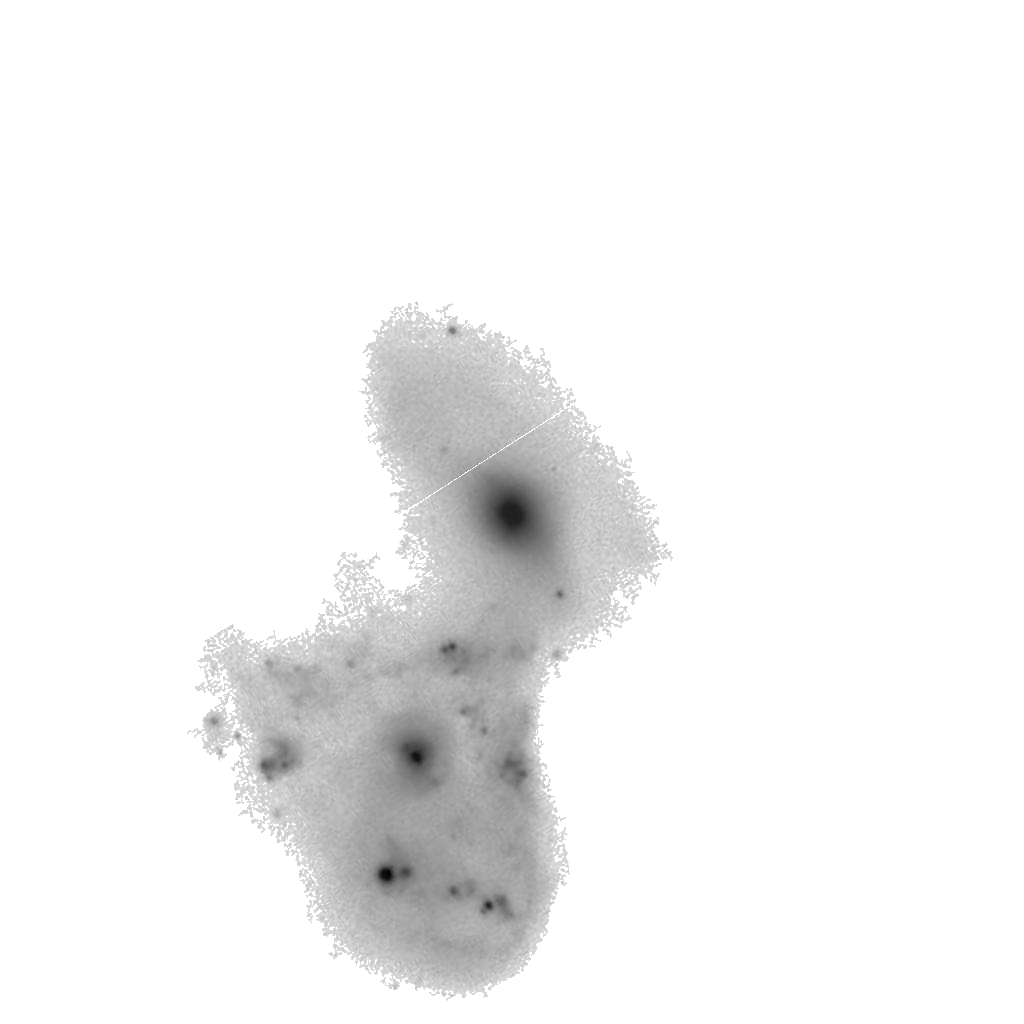
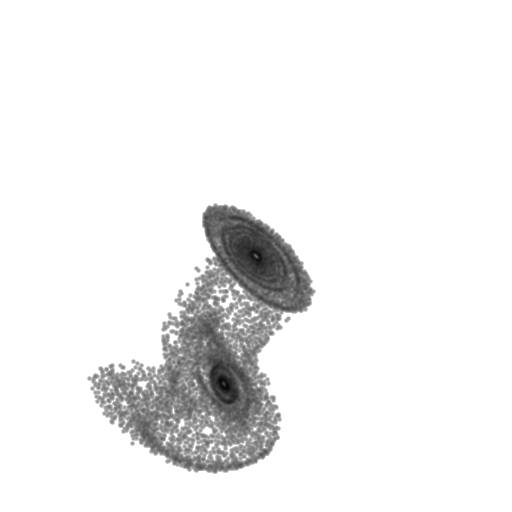
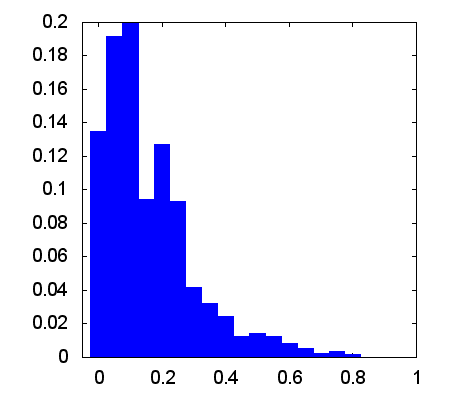
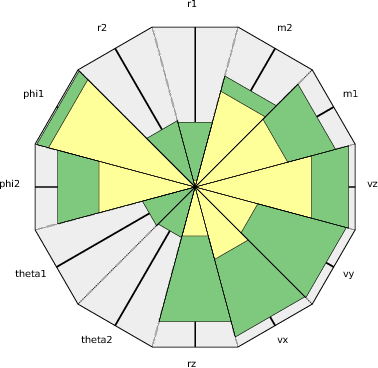
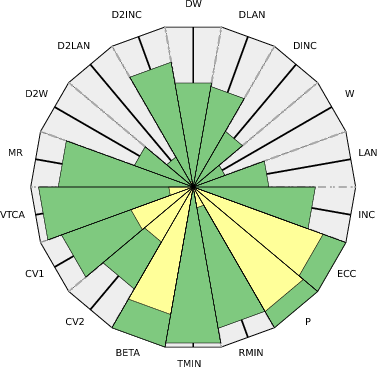
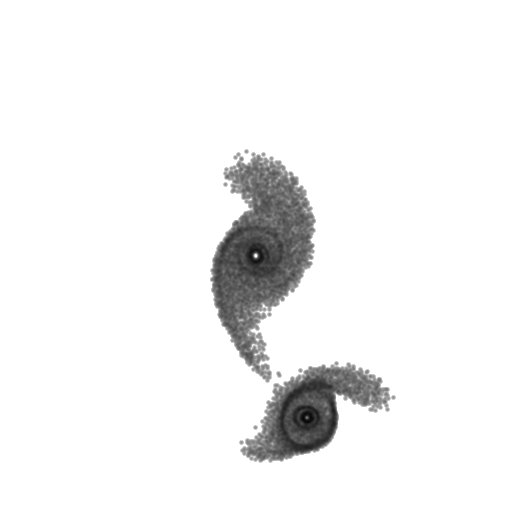
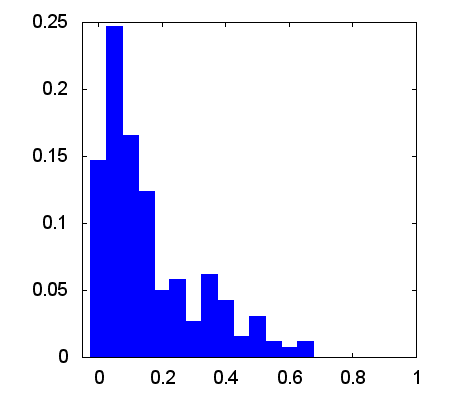
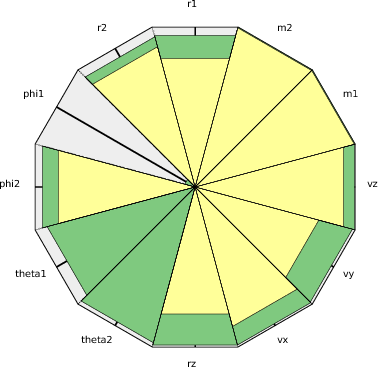
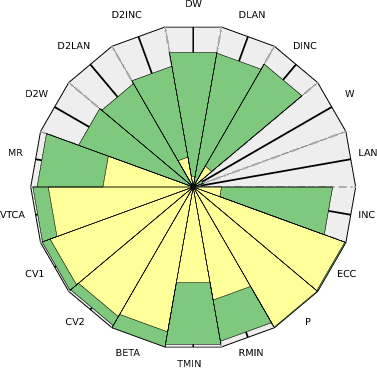
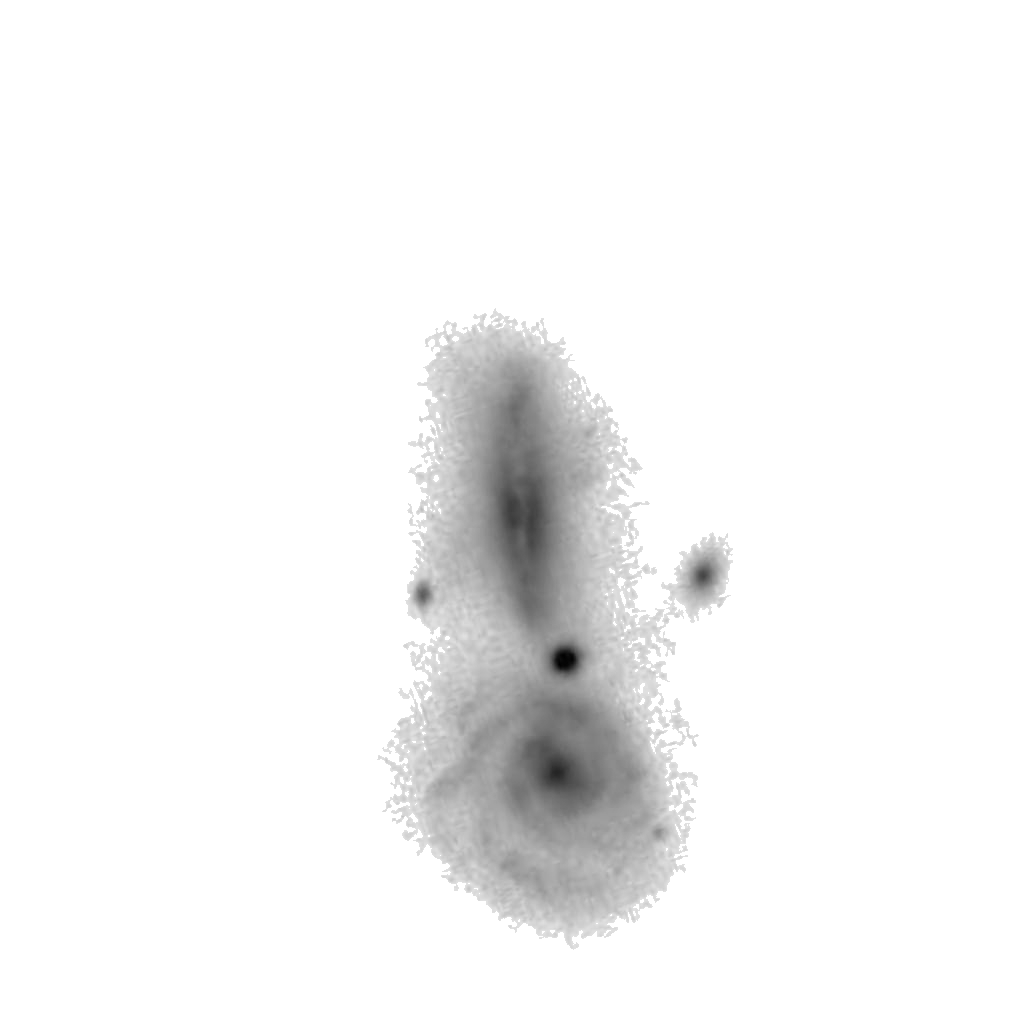
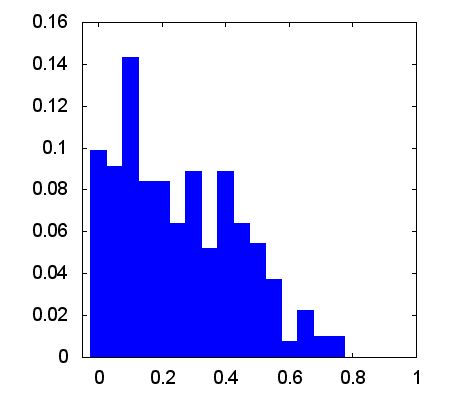
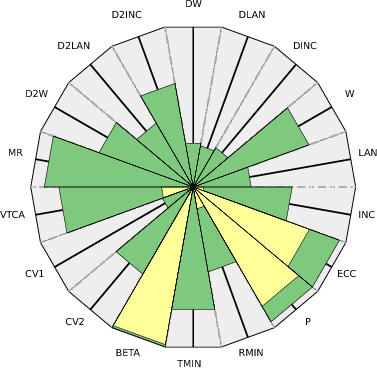
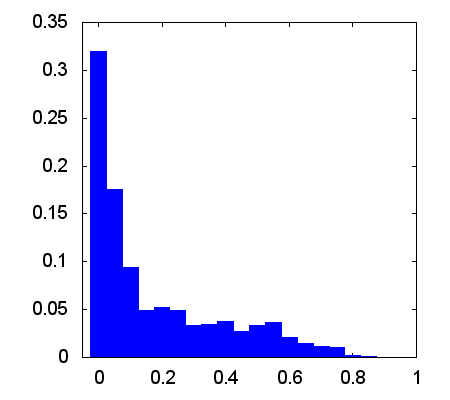
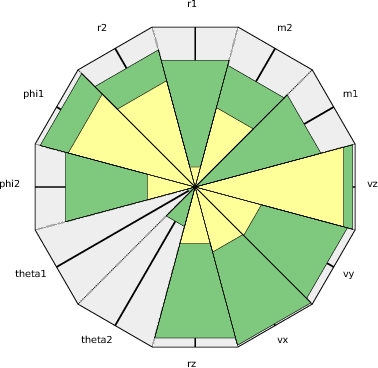
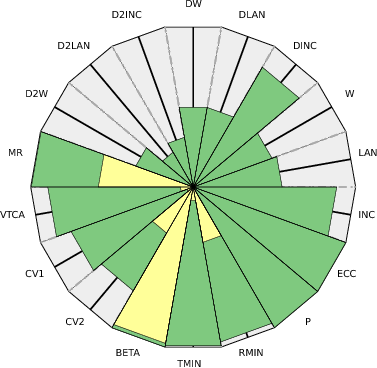
The following images show the fitness distribution and parameter converge for each system.
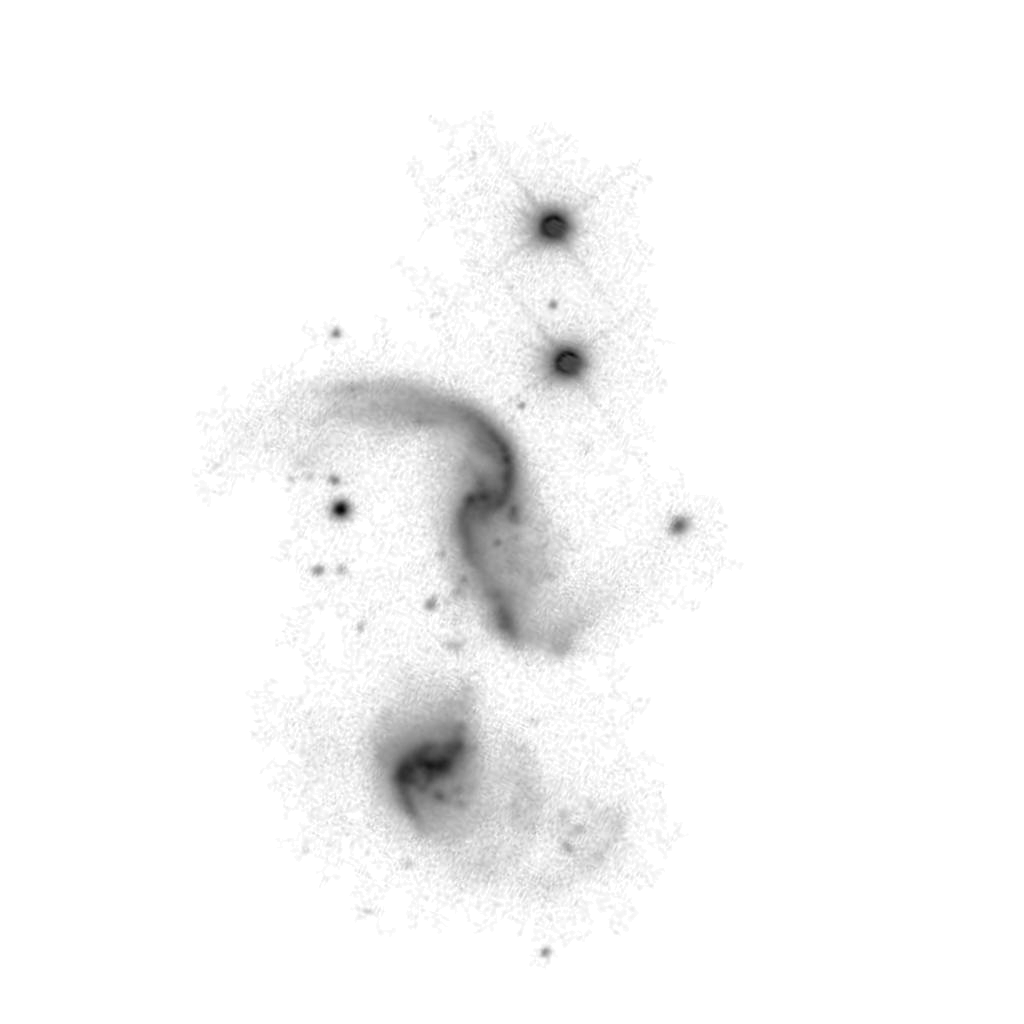
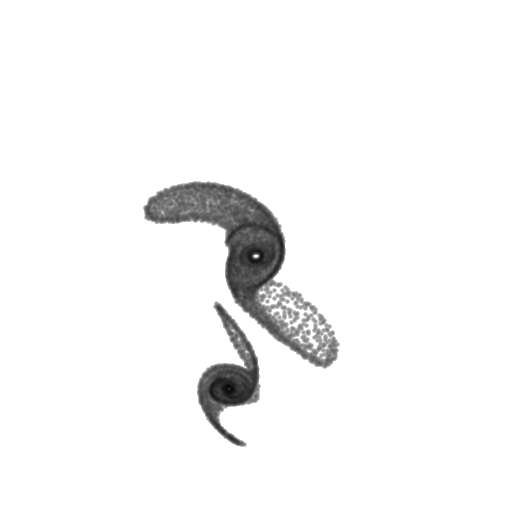
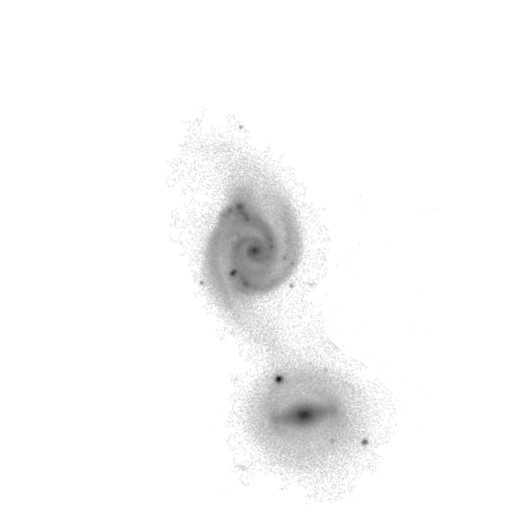
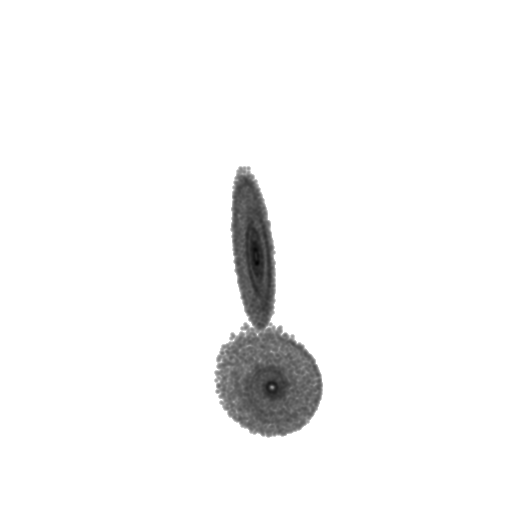
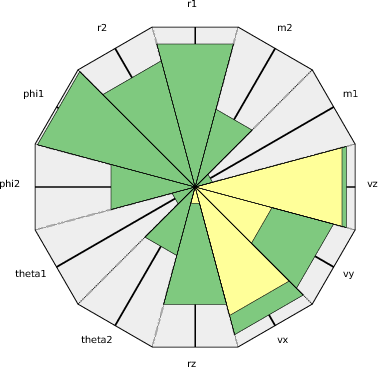
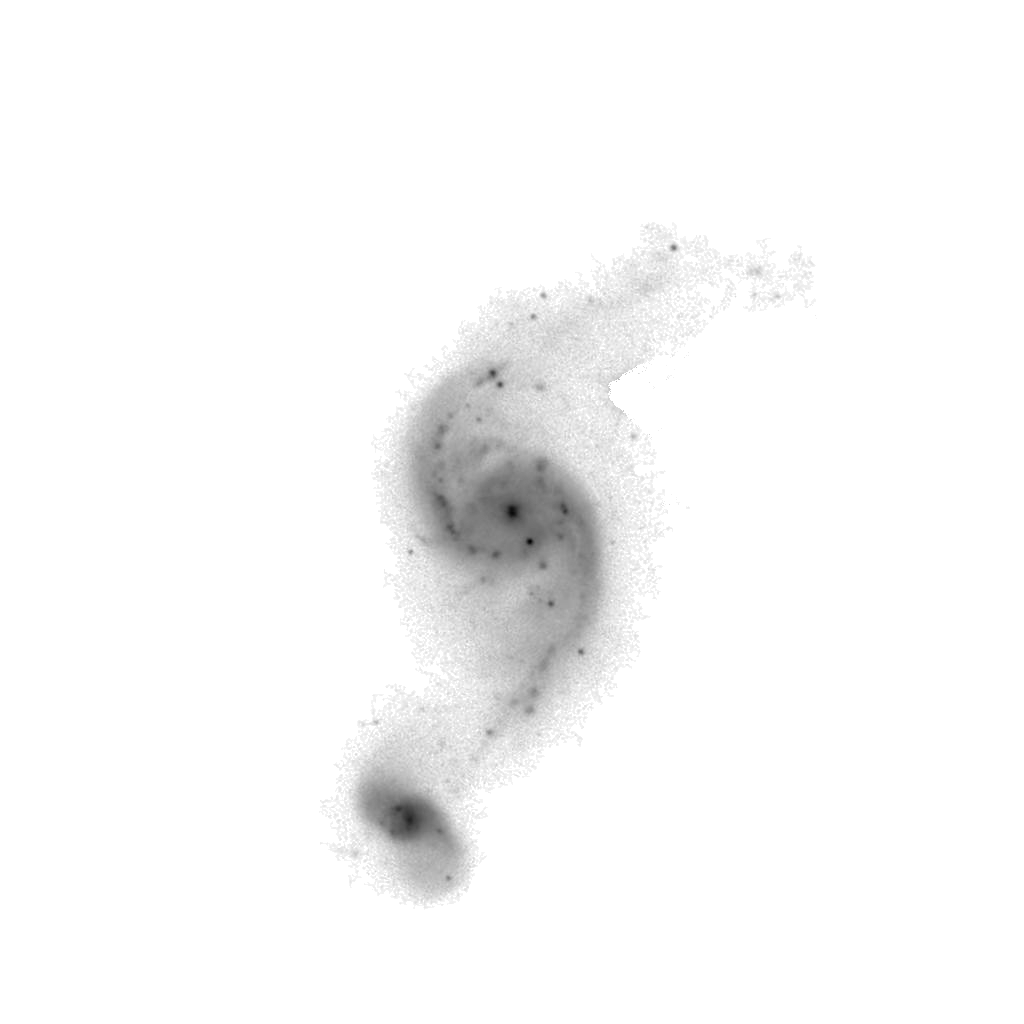
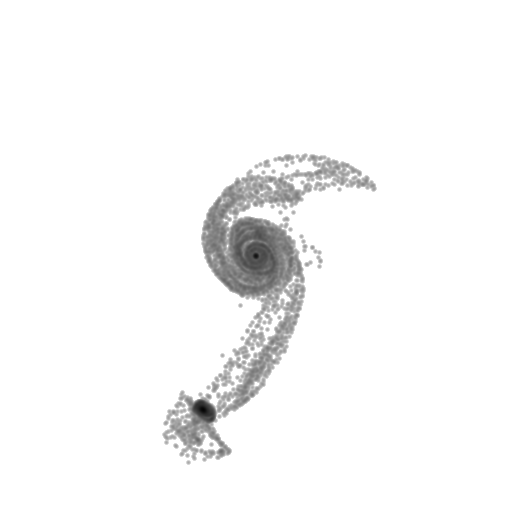
| Target Image | Best Simulation | Fitness Distribution | Simulation Distribution | Orbit Distribution |
|---|---|---|---|---|
| | | | |
| | | | |
| | | | |
| | | | |
| | | | |
| | | | |
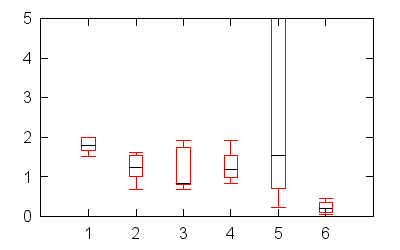
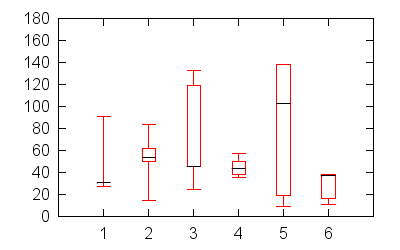
The box plot on the left shows the distribution of eccentricity values for the top simulations by target. The plot on the right shows the distribution of inclinations.
The following tables include links to more information about each system.
| Target Image | Best Simulation | Links |
|---|---|---|
| | System Details Run Simulation Simulation Data Database Info |
| Target Image | Best Simulation | Links |
|---|---|---|
| | System Details Run Simulation Simulation Data Database Info |
| Target Image | Best Simulation | Links |
|---|---|---|
| | System Details Run Simulation Simulation Data Database Info |
| Target Image | Best Simulation | Links |
|---|---|---|
| | System Details Run Simulation Simulation Data Database Info |
| Target Image | Best Simulation | Links |
|---|---|---|
| | System Details Run Simulation Simulation Data Database Info |
| Target Image | Best Simulation | Links |
|---|---|---|
| | System Details Run Simulation Simulation Data Database Info |