Use the navigation bar on the left to find each data release.
Galaxy Zoo 1 data release
The original Galaxy Zoo project ran from July 2007 until February 2009. It was replaced by Galaxy Zoo 2, Galaxy Zoo: Hubble, and Galaxy Zoo: CANDELS. In the original Galaxy Zoo project, volunteers classified images of Sloan Digital Sky Survey galaxies as belonging to one of six categories - elliptical, clockwise spiral, anticlockwise spiral, edge-on , star/don't know, or merger.
Full catalog
This webpage allows anyone to download the resulting GZ classifications of nearly 900,000 galaxies in the project.
Galaxy Zoo is described in Lintott et al. 2008, MNRAS, 389, 1179 and the data release is described in Lintott et al. 2011, 410, 166. Anyone making use of the data should cite at least one of these papers in any resulting publications.
| Table 2 | |
| This table gives classifications of galaxies which have spectra included in SDSS Data Release 7. The fraction of the vote in each of the six categories is given, along with debiased votes in elliptical and spiral categories and flags identifying systems as classified as spiral, elliptical or uncertain. | |
| CSV (gzipped) | GalaxyZoo1_DR_table2.csv.gz |
| CSV (zip) | GalaxyZoo1_DR_table2.csv.zip |
| FITS | GalaxyZoo1_DR_table2.fits |
| VOTable | GalaxyZoo1_DR_table2.vot.gz |
| Note: the provided flags in Table 2 are there for the convenience of users who do not want to get into the details too much. These are based upon a vote fraction threshold of 0.8. However, there is a complication in the debiasing (described in Bamford et al. 2009). The classification bias depends on whether one uses the type likelihoods directly, or applies a threshold. The bias is worse if thresholds are used. We therefore applied bias corrections computed in consistent fashion. So, for the debiased type likelihoods we computed the bias correction based on the elliptical/spiral ratio using the likelihoods directly; for the type flags we debiased the raw type likelihoods using a correction based on the elliptical/spiral ratio determined after applying a 0.8 threshold, and then applied the same threshold to produce the flags. Therefore, the type flags do not correspond to simply applying a 0.8 threshold on the debiased type likelihoods, though for many galaxies these will agree. | |
| Table 3 | |
| This table gives classifications of galaxies included in the Galaxy Zoo sample which did not have spectra available in SDSS Data Release 7. It is not possible to estimate the bias in this sample without accurate redshifts, and so only the fraction of the vote in each of the six categories is given. | |
| CSV (gzipped) | GalaxyZoo1_DR_table3.csv.gz |
| CSV (zip) | GalaxyZoo1_DR_table3.csv.zip |
| FITS | GalaxyZoo1_DR_table3.fits |
| VOTable | GalaxyZoo1_DR_table3.vot.gz |
| Table 4 | |
| This table gives a series of measures of the classification confidence. | |
| CSV (gzipped) | GalaxyZoo1_DR_table4.csv.gz |
| CSV (zip) | GalaxyZoo1_DR_table4.csv.zip |
| FITS | GalaxyZoo1_DR_table4.fits |
| VOTable | GalaxyZoo1_DR_table4.vot.gz |
| Table 5 | |
| This table gives the results from the bias study that introduced mirrored images. | |
| CSV (gzipped) | GalaxyZoo1_DR_table5.csv.gz |
| CSV (zip) | GalaxyZoo1_DR_table5.csv.zip |
| FITS | GalaxyZoo1_DR_table5.fits |
| VOTable | GalaxyZoo1_DR_table5.vot.gz |
| Table 6 | |
| This table gives the results from the bias study that introduced monochrome images. | |
| CSV (gzipped) | GalaxyZoo1_DR_table6.csv.gz |
| CSV (zip) | GalaxyZoo1_DR_table6.csv.zip |
| FITS | GalaxyZoo1_DR_table6.fits |
| VOTable | GalaxyZoo1_DR_table6.vot.gz |
| Table 7 | |
| This table gives the fraction of votes in each of the six categories, combining results from the main and bias studies. | |
| CSV (gzipped) | GalaxyZoo1_DR_table7.csv.gz |
| CSV (zip) | GalaxyZoo1_DR_table7.csv.zip |
| FITS | GalaxyZoo1_DR_table7.fits |
| VOTable | GalaxyZoo1_DR_table7.vot.gz |
CASjobs
These tables are also accessible via CasJobs. Their names are:
- Table 2: DR10.zooSpec
- Table 3: DR10.zooNoSpec
- Table 4: DR10.zooConfidence
- Table 5: DR10.zooMirrorBias
- Table 6: DR10.zooMonochrome
- Table 7: DR10.zooVotes
AGN host galaxies
This sample is presented in the Galaxy Zoo 1 paper on AGN host galaxies (Schawinski et al., 2010, ApJ, 711, 284). It is a volume-limited sample of galaxies (0.02 < z < 0.05, Mz < –19.5 AB) with emission line classifications, stellar masses, velocity dispersions and GZ1 morphological classifications. When using this sample, please cite Schawinski et al. (2010) and Lintott et al. (2008, 2011).
Download here: schawinski_GZ_2010_catalogue.fits.gz
| OBJID | SDSS DR7 object ID |
| RA, DEC | RA and dec in J2000.0 |
| REDSHIFT | spectroscopic redshift from SDSS |
| GZ1_MORPHOLOGY | Galaxy Zoo 1 morphology according to the Land et al. (2008) "clean" criterion. This is an integer where 0 = indeterminate, 1 = early type, 3 = merger, 4 = late type |
| BPT_CLASS | Spectroscopic classification of galaxy based on emission lines ratios in the BPT diagram. 0 = no emission lines, 1 = star-forming, 2 = composite, 3 = Seyfert and 4 = LINER. |
| U,G,R,I,Z | SDSS model magnitudes. These are extinction-corrected but not k-corrected. |
| SIGMA, SIGMA_ERR | Stellar velocity dispersion (and error) measured using GANDALF |
| LOG_MSTELLAR | log of stellar mass [M_sun] |
| L_O3 | Extinction-corrected [OIII] luminosity |
Overlapping Galaxy Pairs
This section contains data from the Galaxy Zoo survey for overlapping galaxy pairs, useful for studies of dust absorption. Data is derived from the Zoo 1 and Zoo 2 periods (August 2007–April 2010), and is described in detail by Keel et al. (PASP, 2013, 125, 923). The catalog contains a total of 1990 galaxy pairs.
| Overlapping galaxy pairs | |
| Column description and format | |
| TXT | overlapcatalog.txt |
| Javascript | Overlap candidates (sortable webpage) |
There is a similar file of candidate pairs which were rejected for the final list because of evidence for interaction, other geometric reasons, or for having redshifts the wrong way around for dust backlighting.
| Rejected overlapping galaxy pairs | |
| OverlapRejects.pdf | |
| Javascript | Overlap rejects (sortable webpage) |
The various overlapping galaxy pair types are illustrated in Figures 2a and 2b from Keel et al. 2013. Below are PDF files containing a single page for each galaxy pair, plus finding charts, more detailed photometry and identifications, and in some cases more precise redshifts. The PDFs are also available at http://astronomy.ua.edu/keel/observe/PDFcharts.
| SDSSOverlaps00Final.pdf | RA: 00–10 hours |
| SDSSOverlaps10final.pdf | RA: 10–13 hours |
| SDSSOverlaps13final.pdf | RA: 13–15 hours |
| SDSSOverlaps15final.pdf | RA: 15–24 hours |
Merging galaxies
This sample of merging galaxies is assembled from SDSS Galaxy Zoo 1 data. It is a homogenous sample of galaxies (0.005 < z < 0.1) with spectroscopy for at least one of two merging galaxies in the pair. Value-added GZ data includes the morphologies of the merging galaxies as well as the relative stage of the merger. For any use of data from this sample, please cite Darg et al. (2010a) and Darg et al. (2010b).
| Merging galaxies | |
| Column description and format | |
| CSV | darg_mergers.csv |
| FITS | darg_mergers.fits |
Green peas
"Green peas" are compact galaxies with extremely high star-formation rates. Their name comes from their appearance in colour SDSS images, which is due to strong [OIII] λ5007 emission that appears in the r-band filter for large numbers of low-redshift (0.112 < z < 0.360) galaxies. Properties of the initial sample are described in Cardamone et al. (2009). Data below is from Table 4 in Cardamone et al. (2009).
| Green pea galaxies | |
| Column description and format | |
| CSV | peas_tbl14.csv |
| FITS | peas_tbl14.fits |
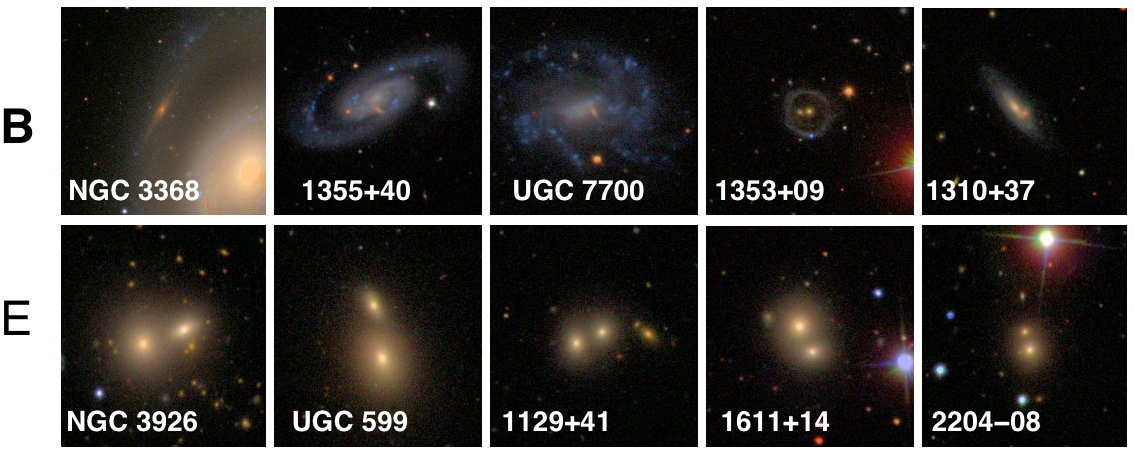
Red Spirals
"Red Spirals" are galaxies with clearly identified spiral structure which are optically red in colour. Most spiral galaxies are blue in colour, while most ellipticals are red, so this sample of red spirals is an interesting intermediate population. The properties of a sample of disky red spirals are described in Masters et al. (2010), and compared to a match sample of normal blue spirals. The data below is from Appendix A, Tables A1 and A2 in Masters et al. (2010) and gives the red and blue spiral samples from that work.
| Red Spiral galaxies | |
| ASCII | RedSpiralsA1.txt |
| ASCII | BlueSpiralsA2.txt |
Galaxy Zoo 2
Galaxy Zoo 2 (GZ2) was the successor project to Galaxy Zoo. GZ2 extends the original Galaxy Zoo classifications for a subsample of the brightest and largest galaxies in the Legacy release, measuring more detailed morphological features. This includes galactic bars, spiral arm and pitch angle, bulges, edge-on galaxies, relative ellipticities, and many others. Two debiased Galaxy Zoo tables are provided, described in Willett et al. (2013) and Hart et al. (2016): we strongly advise the use of the Hart et al. (2016) table, as this debiases the GZ2 quetion tree most consistently.
Full Catalog
These tables provide the GZ2 classifications for nearly 300,000 galaxies in the SDSS.
The project description and data reduction is in Willett et al. 2013, MNRAS, 435, 2835 — please cite this paper if making any use of the GZ2 data. The table numbers below are the same as their order in the paper.
| Table 1 - Normal-depth sample with new debiasing method | |
| Table 1 contains all galaxies that were debiased with the method described in Hart et al. (2016). Galaxies with spectroscopic redshifts classified in GZ2 (from the GZ2 normal, extra and stripe82 normal depth), and apparent r-band magnitudes less than 17.0 are included (239,695 galaxies in total). Please cite Hart et al. (2016) when using these classifications. | |
| Column description and format | |
| CSV | https://gz2hart.s3.amazonaws.com/gz2_hart16.csv.gz |
| FITS | https://gz2hart.s3.amazonaws.com/gz2_hart16.fits.gz |
| VOTable | https://gz2hart.s3.amazonaws.com/gz2_hart16.vot.gz |
| Table 5 - Main sample, spectroscopic redshifts | |
| Table 5 gives classifications of the 243,500 galaxies in the main sample with spectroscopic redshifts. This is the primary GZ2 data release, containing the largest number of galaxies and the most reliable morphologies. | |
| Column description and format | |
| CSV | zoo2MainSpecz.csv.gz |
| FITS | zoo2MainSpecz.fits.gz |
| VOTable | zoo2MainSpecz.vot.gz |
| Table 6 - Main sample, photometric redshifts | |
| Table 6 gives classifications of the 42,462 galaxies in the main sample with photometric redshifts only. Debiased morphologies for this sample are slightly more uncertain than Table 5, since the data reduction requires a redshift to adjust the morphology for classification bias. | |
| Column description and format | |
| CSV | zoo2MainPhotoz.csv.gz |
| FITS | zoo2MainPhotoz.fits.gz |
| VOTable | zoo2MainPhotoz.vot.gz |
| Table 7 - Stripe 82, normal-depth | |
| Table 7 gives classifications of the 17,787 galaxies classified in single-depth Stripe 82 images. The magnitude limit for Stripe 82 classifications (r<17.7) is slightly deeper than the main samples. Some of these galaxies also appear in the main sample (Table 5). | |
| Column description and format | |
| CSV | zoo2Stripe82Normal.csv.gz |
| FITS | zoo2Stripe82Normal.fits.gz |
| VOTable | zoo2Stripe82Normal.vot.gz |
| Table 8 - Stripe 82, coadded-depth (set 1) | |
| Table 8 gives classifications of the first set of 19,765 galaxies classified in the coadded (runs 106 and 206) Stripe 82 images. Coadded images are made from combining between 47–55 individual exposures, resulting in better detection of fainter features and improved seeing. This set of images had no adjustments made to its background, which resulted in coloured background noise for some galaxies. | |
| Column description and format | |
| CSV | zoo2Stripe82Coadd1.csv.gz |
| FITS | zoo2Stripe82Coadd1.fits.gz |
| VOTable | zoo2Stripe82Coadd1.vot.gz |
| Table 9 - Stripe 82, coadded-depth (set 2) | |
| Table 9 gives classifications of the second set of 19,761 galaxies classified in the coadded (runs 106 and 206) Stripe 82 images. Coadded images are made from combining between 47–55 individual exposures, resulting in better detection of fainter features and improved seeing. This set of images applied a modest colour desaturation to de-emphasise background noise in the coadded data. | |
| Column description and format | |
| CSV | zoo2Stripe82Coadd2.csv.gz |
| FITS | zoo2Stripe82Coadd2.fits.gz |
| VOTable | zoo2Stripe82Coadd2.vot.gz |
| SDSS metadata for GZ2 | |
| This table provides pre-matched sets of metadata for the Galaxy Zoo 2 samples taken from DR7. This includes coordinates, photometry, size, and redshifts (where present). For science cases, we encourage users to instead use the latest measurements from the latest data release. | |
| Column description and format | |
| CSV | gz2sample.csv.gz |
| FITS | gz2sample.fits.gz |
| VOTable | gz2sample.vot.gz |
The code used to reduce GZ2 is available on GitHub — please take a look either at its webpage or fork it from the repository if you're interested in the details.
CASjobs
The GZ2 catalog is also accessible via CasJobs in Data Release 10. The table names in CasJobs are:
- Table 5: DR10.zoo2MainSpecz
- Table 6: DR10.zoo2MainPhotoz
- Table 7: DR10.zoo2Stripe82Normal
- Table 8: DR10.zoo2Stripe82Coadd1
- Table 9: DR10.zoo2Stripe82Coadd2
SDSS Skyserver
For any object in SDSS DR10, you can access its Galaxy Zoo or Galaxy Zoo 2 classifications (if present) by using the "Explore" tool. Just click the "Galaxy Zoo" link under "Imaging Summary" in the left-hand sidebar (example here).
Bar lengths
In conjunction with Galaxy Zoo 2, we ran a parallel project to measure lengths, widths, and angles of galactic bars using an interactive interface. See Hoyle et al. (2011) for a description of the project and scientific results. The full set of results can be downloaded below.
| Bar lengths: Table 1 | |
| CSV | barlengths.csv |
| FITS | barlengths.fits |
| VOTable | barlengths.vot |
Dust-lane spheroidal galaxies
Early Galaxy Zoo 2 classifications were used to identify a sample of 362 spheroidal galaxies with prominent dust lanes (DLSGs), ranging from redshifts of z=0.01 to 0.07. Catalogues of the galaxy properties, along with multi-wavelength coverage from radio through ultraviolet, are available here.
All tables below are in ASCII format.
- Basic information
- Radio-wavelength data from FIRST
- Infrared photometry from IRAS
- Optical photometry from SDSS
- Optical spectroscopy from SDSS
- UV photometry from GALEX
Please cite the DLSG (Kaviraj et al. 2012; Shabala et al. 2012; Kaviraj et al. 2013) and Galaxy Zoo 2 (Willett et al. 2013) publications if using this data.
Galaxy Zoo: Hubble
Galaxy Zoo: Hubble used data from the Hubble Space Telescope to classify images of distant galaxies beyond the reach of SDSS. Images for GZH were taken from the Advanced Camera for Surveys (ACS) aboard Hubble, including data from multiple Legacy surveys.
Full catalog
The full reduction and analysis of GZ: Hubble was published in Willett et al. (2017) (available both from arXiv or the MNRAS journal). Please cite this paper if using any data from the project. The full data reduction pipeline and analysis codes for GZH are available as an open-source Github repository.
| Table 4 - Morphological classifications for galaxies in main HST sample | |
| Table 4 contains classifications of 113,705 galaxies aggregated from four HST surveys: AEGIS, COSMOS, GEMS, and GOODS (5-epoch imaging only). This is the primary output of the GZH project, with calibrated and debiased morphological classifications for galaxies out to z ≲ 4. | |
| Column description and format | |
| CSV | gz_hubble_main.csv.gz |
| FITS | gz_hubble_main.fits.gz |
| VOTable | gz_hubble_main.vot.gz |
| Table 5 - Morphological classifications for faded galaxies | |
| Table 5 contains classifications of 3,927 galaxies from the COSMOS survey. These images were faded to very low colour saturation before classification, and tested the effects of colour gradients on morphological consistency. | |
| Column description and format | |
| CSV | gz_hubble_faded.csv.gz |
| FITS | gz_hubble_faded.fits.gz |
| VOTable | gz_hubble_faded.vot.gz |
| Table 6 - Morphological classifications for recoloured galaxies | |
| Table 6 contains classifications of 3,927 galaxies from the COSMOS survey. These colour composite images had the red and blue channels swapped from default settings, and tested the effects of colour perception on morphological consistency. | |
| Column description and format | |
| CSV | gz_hubble_recoloured.csv.gz |
| FITS | gz_hubble_recoloured.fits.gz |
| VOTable | gz_hubble_recoloured.vot.gz |
| Table 7 - Morphological classifications for galaxies from 2-epoch GOODS imaging | |
| Table 7 contains classifications of 6,144 galaxies from the GOODS-N and GOODS-S surveys. These images are shallow exposures created from 2-epoch imaging, as contrasted with the deeper 5-epoch imaging of galaxies from GOODS in Table 4. | |
| Column description and format | |
| CSV | gz_hubble_goods_shallow.csv.gz |
| FITS | gz_hubble_goods_shallow.fits.gz |
| VOTable | gz_hubble_goods_shallow.vot.gz |
| Table 8 - Morphological classifications for single-epoch SDSS images of galaxies in Stripe 82 | |
| Table 8 contains classifications of 21,522 galaxies located in SDSS Stripe 82. The images come from single-epoch observations by SDSS, but use the same decision tree and interface as the data in Tables 4-7. These images provide a low-redshift counterpart to the data from the various Hubble surveys. | |
| Column description and format | |
| CSV | gz_hubble_sdss_single.csv.gz |
| FITS | gz_hubble_sdss_single.fits.gz |
| VOTable | gz_hubble_sdss_single.vot.gz |
| Table 9 - Morphological classifications for co-added SDSS images of galaxies in Stripe 82 | |
| Table 9 contains classifications of 30,339 galaxies located in SDSS Stripe 82. The images come from co-added observations over dozens of epochs by SDSS, as compared to the shallower single-epoch images in Table 8. | |
| Column description and format | |
| CSV | gz_hubble_sdss_coadd.csv.gz |
| FITS | gz_hubble_sdss_coadd.fits.gz |
| VOTable | gz_hubble_sdss_coadd.vot.gz |
| Table 10 - Morphological classifications for images with simulated AGN | |
| Table 10 contains classifications of 2,961 HST images that contain both a real galaxy and a simulated nuclear point source of varying intensity and colour. These images tested the effects of optically-bright AGN on morphological classification. | |
| Column description and format | |
| CSV | gz_hubble_simulated_agn.csv.gz |
| FITS | gz_hubble_simulated_agn.fits.gz |
| VOTable | gz_hubble_simulated_agn.vot.gz |
| Metadata | ||
| These tables contain useful metadata matched to the morphological data in Tables 4–9. This includes (where available) redshifts, magnitudes, angular sizes, automatically-measured morphological parameters, and additional flags from the parent surveys. | ||
| Single zipped file including column descriptions and FITS tables with metadata for all GZ: Hubble images | ||
| GZH main sample | CSV | FITS |
| GZH GOODS, shallow-depth imaging | CSV | FITS |
| GZH GOODS, full-depth imaging | CSV | FITS |
| GZH SDSS, coadded imaging | CSV | FITS |
| GZH SDSS, single-depth imaging | CSV | FITS |
| FERENGI-processed images | CSV | FITS |
Bar fraction evolution
Melvin et al. (2014) used GZ2 and preliminary GZ: Hubble data to study the evolution of the bar fraction in galaxies over cosmic timescales. Presented here are links to webpages with the HST postage stamp images for the different galaxy samples.
- GZ: Hubble disk galaxy sample split into three stellar mass bins:
Shown here is a diagram of the classification scheme and decision tree used in GZ: Hubble.
Galaxy Zoo: CANDELS
Galaxy Zoo: CANDELS classified the morphology of galaxies in images from the Cosmic Assembly Near-infrared Deep Extragalactic Legacy Survey (CANDELS). CANDELS images were taken with both the ACS and WFC3 cameras on the Hubble Space Telescope, focusing on rest-frame optical wavelengths of galaxies at redshifts of 1 < z < 3.
Simmons et al. (2017) (available both from arXiv or the MNRAS journal) describes the project and data release. Please cite this paper if using any data from Galaxy Zoo: CANDELS.
Full catalog
| Table 2 - main release | |
| Raw and weighted classifications for the full Galaxy Zoo: CANDELS sample. The rows/columns are transposed from the version in the printed article (which was done only to illustrate form and content). In this table, each row corresponds to an individual galaxies and the columns to the various morphological parameters. This table includes raw and weighted morphological classifications for all tasks in the GZC classification tree for each of the 49,555 unique sources in the sample. | |
| Column description and format | |
| CSV | gz_candels_table_2_main_release.csv |
| FITS | gz_candels_table_2_main_release.fits |
| VOTable | gz_candels_table_2_main_release.vot |
| Table 4 - depth corrections | |
| Classifications and depth-corrections for 10,648 galaxies in GZC that had imaging at multiple co-added epochs. If your science question benefits from having classifications from images comparable depth across an entire sample, we recommend using the _deepcorr classifications in this table for subjects in the deeper fields. | |
| Column description and format | |
| CSV | gz_candels_table_4_depth_corr.csv |
| FITS | gz_candels_table_4_depth_corr.fits |
| VOTable | gz_candels_table_4_depth_corr.vot |
Galaxy Zoo DECaLS
Galaxy Zoo DECaLS has now been superceded by Galaxy Zoo DESI.
GZ DESI extends the Galaxy Zoo DECaLS morphological classifications to the full DESI footprint (instead of just the intersection of SDSS and DECaLS),
increasing sky coverage by a factor of four.
New research projects should use the Galaxy Zoo DESI catalogues, available in the next section.
The text below is left for reference.
Galaxy Zoo DECaLS classified the morphology of galaxies in images from the Dark Energy Camera Legacy Survey (DECaLS). DECaLS images were taken with the Dark Energy Camera (DECam) on the Blanco 4m telescope, located at the Cerro Tololo Inter-American Observatory. Deeper DECaLS images (r=23.6 versus r=22.2 from SDSS) reveal spiral arms, weak bars, and tidal features not previously visible in SDSS imaging. We released classifications for 314,000 galaxies.
For the first time, we included automatic morphology predictions made using deep learning models. These models are trained on volunteer answers and predict posteriors for what a typical volunteer might say. When tested on galaxies where the volunteers are confident, they were 99% accurate on every question. Code and extensive documentation are available if you would like to extend these models or apply them to new problems.
Walmsley et al. (2021) (available free from the MNRAS journal) describes the project and current data release. Please cite this paper if using any data from Galaxy Zoo DECaLS.
Catalogue, Images, Models
The GZ DECaLS data is available via Zenodo. This includes:
- Morphology classifications from, typically, 5 to 40 volunteers per galaxy (see the paper)
- Morphology classifications from deep learning models, trained by those volunteers
- The images uploaded to Galaxy Zoo (100GB)
The DECaLS models, and code used to create them, were previously available via the Zoobot GitHub repository. Our models have continued to advance since GZ DECaLS was published, and are now significantly more accurate at classifying galaxy morphology. Zoobot now hosts our latest models.
Galaxy Zoo DESI (8.7M)
Galaxy Zoo DESI includes detailed morphology measurements for 8.67 million galaxies in the DESI Legacy Imaging Surveys (DECaLS, MzLS, and BASS, plus DES).
These are automated measurements made by deep learning models trained on Galaxy Zoo volunteer votes.
Extending our morphology measurements outside of the previously-released DECaLS/SDSS intersection increases our sky coverage by a factor of 4 (5,000 to 19,000 deg$^2$) and allows for full overlap with complementary surveys including ALFALFA and MaNGA.
Our models typically predict the fraction of volunteers selecting each answer to within 5-10\% for every answer to every GZ question.
The models are trained on newly-collected votes for DESI-LS DR8 images as well as historical votes from GZ DECaLS.
Code and extensive documentation are available if you would like to extend these models or apply them to new problems.
Walmsley et al. (2023) (available free from the MNRAS journal) describes the project and current data release. Please cite this paper if using any data from Galaxy Zoo DESI.
Catalogue, Models
The GZ DESI data is available via Zenodo. We provide two versions of our morphology catalogue; a "friendly" version (600MB) with just the morphology measurements, and an "advanced" version (8GB) which also includes 90% confidence intervals and a measure of question relevance. See the Zenodo page for more details.
The morphology catalogue is also available from NOIRLab's Astro Data Lab and from Vizier. Both services allow you to cross-match our catalogue against your own catalogues. Astro Data Lab also hosts data from DESI itself, allowing you to query DESI spectra and GZ DESI morphology measurements with the same tools.
The sheer size of the images prepared for our volunteers and models (approx. 1TB) prevents us from including them in this data release. The original data is available via the Legacy Survey FITS cutout service (select Data Release 8 for an exact replication). We may be able to arrange sharing the prepared images on a case-by-case basis; please reach out if this is crucial to your research.
Trained model weights, and code to reproduce those models, are available via the Zoobot GitHub repository. Zoobot includes our latest models and is designed to be easily finetuned to new surveys and new morphology-related tasks.
Galaxy Zoo: Mergers
See this page for full details and data for the separate Galaxy Zoo: Mergers project.
Galaxy Builder
Galaxy Builder made use of citizen science to create disc-bulge-bar-spiral photometric models of 198 spiral galaxies, selected using GZ2 and the NASA-Sloan Atlas. The project is further described in Lingard et al. (2020).
| Galaxy Builder main catalogue | |
| Column description and format | |
| CSV | galaxy-builder-catalog.csv |
Data visualizations
For an interactive visualization of the decision trees for each of the Galaxy Zoo projects, please look at this tool created by Coleman Krawczyk (University of Portsmouth).